

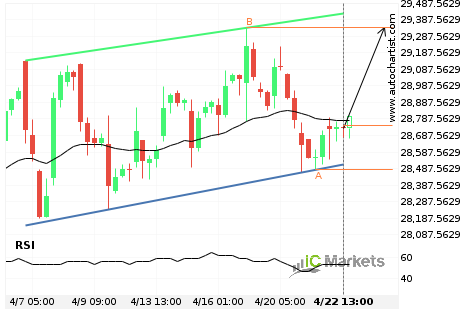
Hong Kong 50 Index – getting close to resistance of a Triangle
Hong Kong 50 Index is moving towards the resistance line of a Triangle. Because we have seen it retrace from this line before, we could see either a break through this line, or a rebound back to current levels. It has touched this line numerous times in the last 10 days and may test it […]
Should we expect a breakout or a rebound on FTSE China A50 Index?
The movement of FTSE China A50 Index towards the support line of a Descending Triangle is yet another test of the line it reached numerous times in the past. We expect this line test to happen in the next 2 days, but it is uncertain whether it will result in a breakout through this line, […]

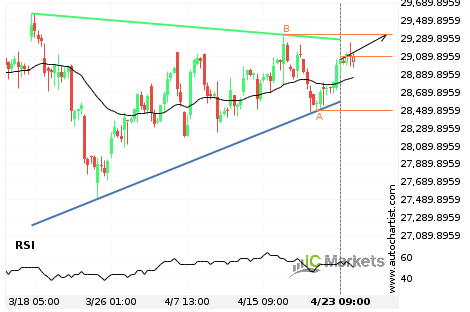
Australia 200 Index – getting close to resistance of a Triangle
Australia 200 Index is moving towards the resistance line of a Triangle. Because we have seen it retrace from this line before, we could see either a break through this line, or a rebound back to current levels. It has touched this line numerous times in the last 12 days and may test it again […]
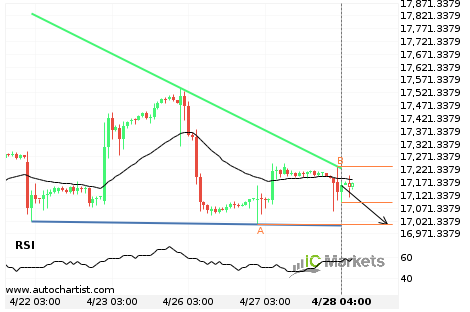
FTSE China A50 Index – getting close to psychological price line
FTSE China A50 Index is moving towards the support line of a Support. Because we have seen it retrace from this positions in the past, we could see either a break through this line, or a rebound back to current lines. It has touched this line numerous times in the last 18 days and may […]
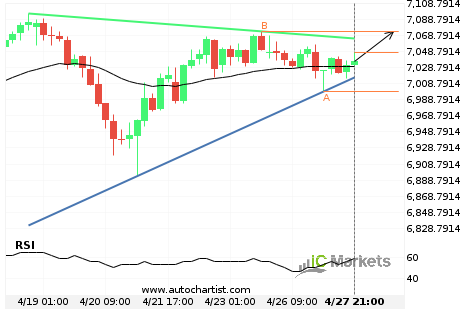
Either a rebound or a breakout imminent on Hong Kong 50 Index
Hong Kong 50 Index is heading towards the resistance line of a Triangle. If this movement continues, we expect the price of Hong Kong 50 Index to test 29336.8000 within the next 3 days. But don’t be so quick to trade, it has tested this line numerous times in the past, so this movement could […]
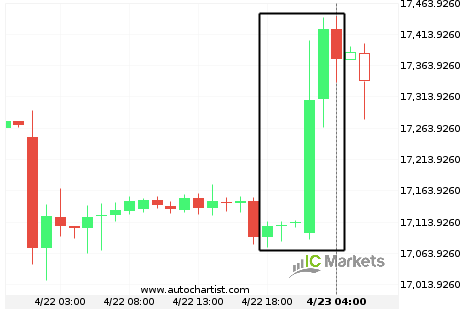
What’s going on with FTSE China A50 Index?
Those of you that are trend followers are probably eagerly watching FTSE China A50 Index to see if its latest 2.31% move continues. If not, the mean-reversion people out there will be delighted to cash in on this exceptionally large 2 days move.

What’s going on with FTSE China A50 Index?
Those of you that are trend followers are probably eagerly watching FTSE China A50 Index to see if its latest 2.31% move continues. If not, the mean-reversion people out there will be delighted to cash in on this exceptionally large 2 days move.
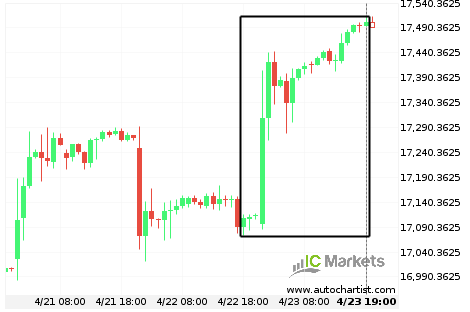
Huge bullish move on FTSE China A50 Index
FTSE China A50 Index has moved higher by 1.56% from 17,089.09 to 17,373.31 in the last 10 hours.
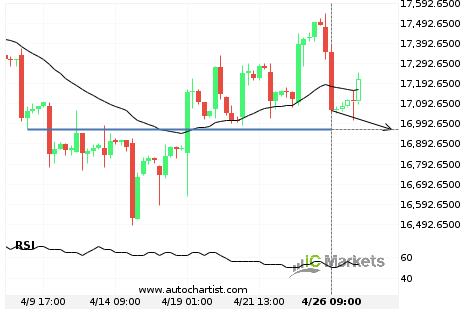
Hong Kong 50 Index – getting close to resistance of a Channel Up
Hong Kong 50 Index is moving towards the resistance line of a Channel Up. Because we have seen it retrace from this line before, we could see either a break through this line, or a rebound back to current levels. It has touched this line numerous times in the last 16 days and may test […]